

Impure is a visual programming language aimed to gather, process and visualize information. With impure is possible to obtain information from very different sources; from user owned data to diverse feeds in internet, including social media data, real time or historical financial information, images, news, search queries and many more. Impure is a tool to be in touch with data around internet, to deeply understand it. Within a modular logic interface you can quickly link information to operators, controls and visualization methods, bringing all the power of the comprehension of information and knowledge to the not programmers that want to work with information in a professional way.
via impure.com


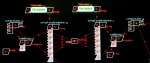


It’s not a plug-and-play application, but it’s not scripting in a text editor either. Think of it as somewhere in between that (hence the visual programming language). They’ve taken the logic behind code, and encapsulated them into modules or structures, and you can piece them together like a puzzle. The interface kind of reminds me of Yahoo Pipes.
For example, you can attach a data piece to an operator (like multiplication), and then fit that with a visualization (or a visualizator, as they call it). So you’re using the same logic as you would in programming, but don’t have any syntax to learn, other than the visual one.
via Advanced visualization without programming – Impure – flowingdata.com
(via Fast Co. Design)
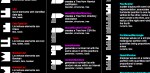
Some pictures from impuregallery’s photostream on Flickr

Pingback: HotPearls by drbazuk - Pearltrees
Pingback: Impure | Pearltrees