
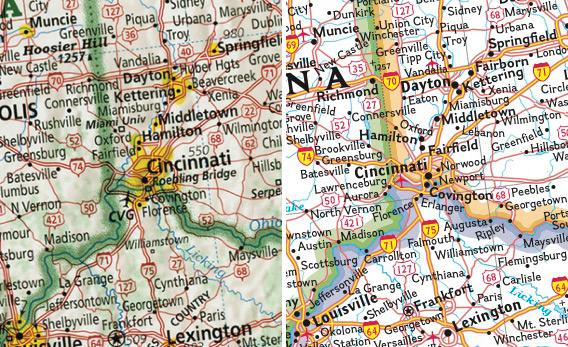
Left: Imus’ map of Cincinnati. Right: National Geographic
Left: Imus map of Cincinnati. Right: National Geographic map of Cincinnati
(via The Greatest Paper Map of the United States You’ll Ever See – slate.com)
Consider these two views of the Cincinnati area. On the right, a National Geographic map employs a featureless white background and arbitrarily colors the state borders purple, green, and orange. On the left, Imus’ map uses a thick green line to indicate all state boundaries—allowing us to more easily recognize that it’s the Ohio River that defines those boundaries. Meanwhile, Imus uses colored shading to reflect the relative forestation level of the area and to accurately capture its gently rolling terrain.
